
Getting a report on your computer’s performance is extremely beneficial for problem-solving. This tool is primarily utilized by IT support team members and system managers to acquire a comprehensive understanding of a computer’s performance, but anyone can benefit from it.
Read on if you want to uncover how to generate a complete Windows 10 Diagnostic Report.
You have the option to run a basic system performance test, but it is also possible to create your own. This manual will help you do both.
Table of ContentsShow
Generating a System Performance Test Report

To start an exam, you may press the Windows button and enter “perfmon” or press Windows button plus R to launch a run window and write the precise term.
Once the performance monitor is open, you will need to look to the left side and click on ”Data Collector Sets”. You then need to expand the ”System” menu and right-click on ”System Performance”. Then, select ”Start” from the context menu that appears.
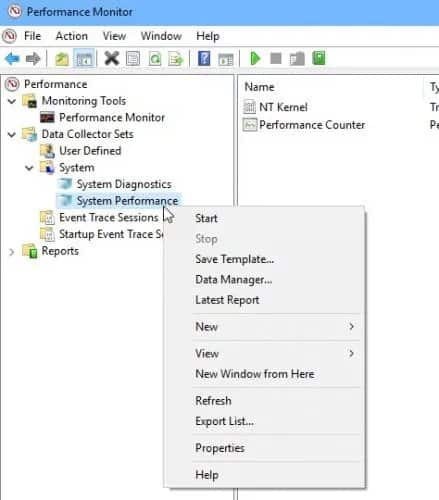
The exam will then commence. After about 60 seconds, you can click on ”Reports”, ”System”, and finally ”System Performance”. This will open the report so you can assess it.

If there is an obvious issue, you will probably find it in the ”Summary” section. This shows you which program is occupying the largest percentage of your CPU and other information, such as which applications are using the most bandwidth, both downloading and uploading.
If you want a more detailed report on any of these, there are separate sections where you can see the full CPU, network, and disk reports which will help you gain a much more complete insight into which operations your PC is executing.
Creating a Custom Performance Test
If you are knowledgeable about computer technology and understand exactly what you want to test your system for, this is the ideal option for you.
Before generating a custom report, you need to create a dedicated data collector set, so the system knows what to examine for.
To accomplish this, you should run the Performance Monitor tool again. Next, like before, expand the “Data Collector Sets”. Afterward, right-click “User Defined”, select “New”, and choose “Data Collector Set”.

A window will appear where you will be asked to name your data collector set and whether you want to create it from a template or manually.
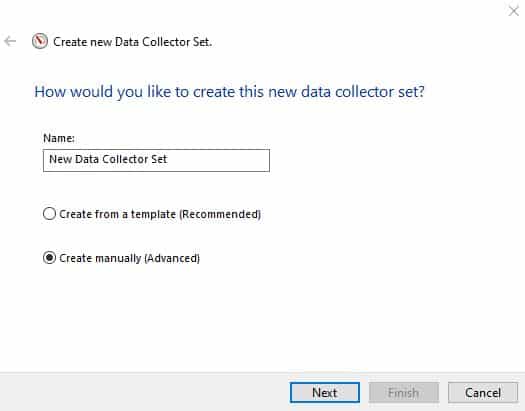
Creating a set from a template doesn’t give you multiple options. If you choose to set it up manually, you will be provided with alternatives to select the data you want to be included.
You will then be asked to identify the functional metrics you want to monitor.

The subsequent prompt will ask which event trace providers you want to activate. If you’re uncertain of what this is, feel free to leave it empty.

Before you are asked to specify a safe location for your document, you will be given the option to include registry keys you wish to monitor while the task is being executed.
With that, you’ve created your own customized dataset.
To use your new set, click under the ”User Defined” options to see your recently created data set. Right-click it and select ”Start”. You can let it run for as long as you want (although it’s best to give it at least a minute). Once you feel the performance has been thoroughly tested, right-click on your current data set and select ”Stop”.
You can analyze the test by simply clicking on “Reports”. However, you now need to click on “User Defined”, which will allow you to thoroughly examine the detailed report.


